[Data + AI Automation] Find Winning SKUs Before the Sale Hits

![[Data + AI Automation] Find Winning SKUs Before the Sale Hits](https://storage.ghost.io/c/29/58/29584234-d41d-4cc7-a520-98b4c87c8015/content/images/size/w1200/2026/01/1_RvpgSsmm_Pz_XccP6aZUEA.webp)
As promo season approaches, deciding which SKUs to spotlight — and whether bundles still drive impact — is more complex than ever. With a flood of new products each cycle, manually sorting through them slows teams down.
In this edition of Data + AI Automation, we show how Trendier Dashboard + ChatGPT can fast-track SKU analysis by auto-tagging products by format and volume — helping teams move faster and plan smarter.
Step 1. Extracting the Data
Trendier Dashboard is an AI-powered tool that monitors real-time global e-commerce data — and visualizes product, brand, and keyword trends across beauty categories.
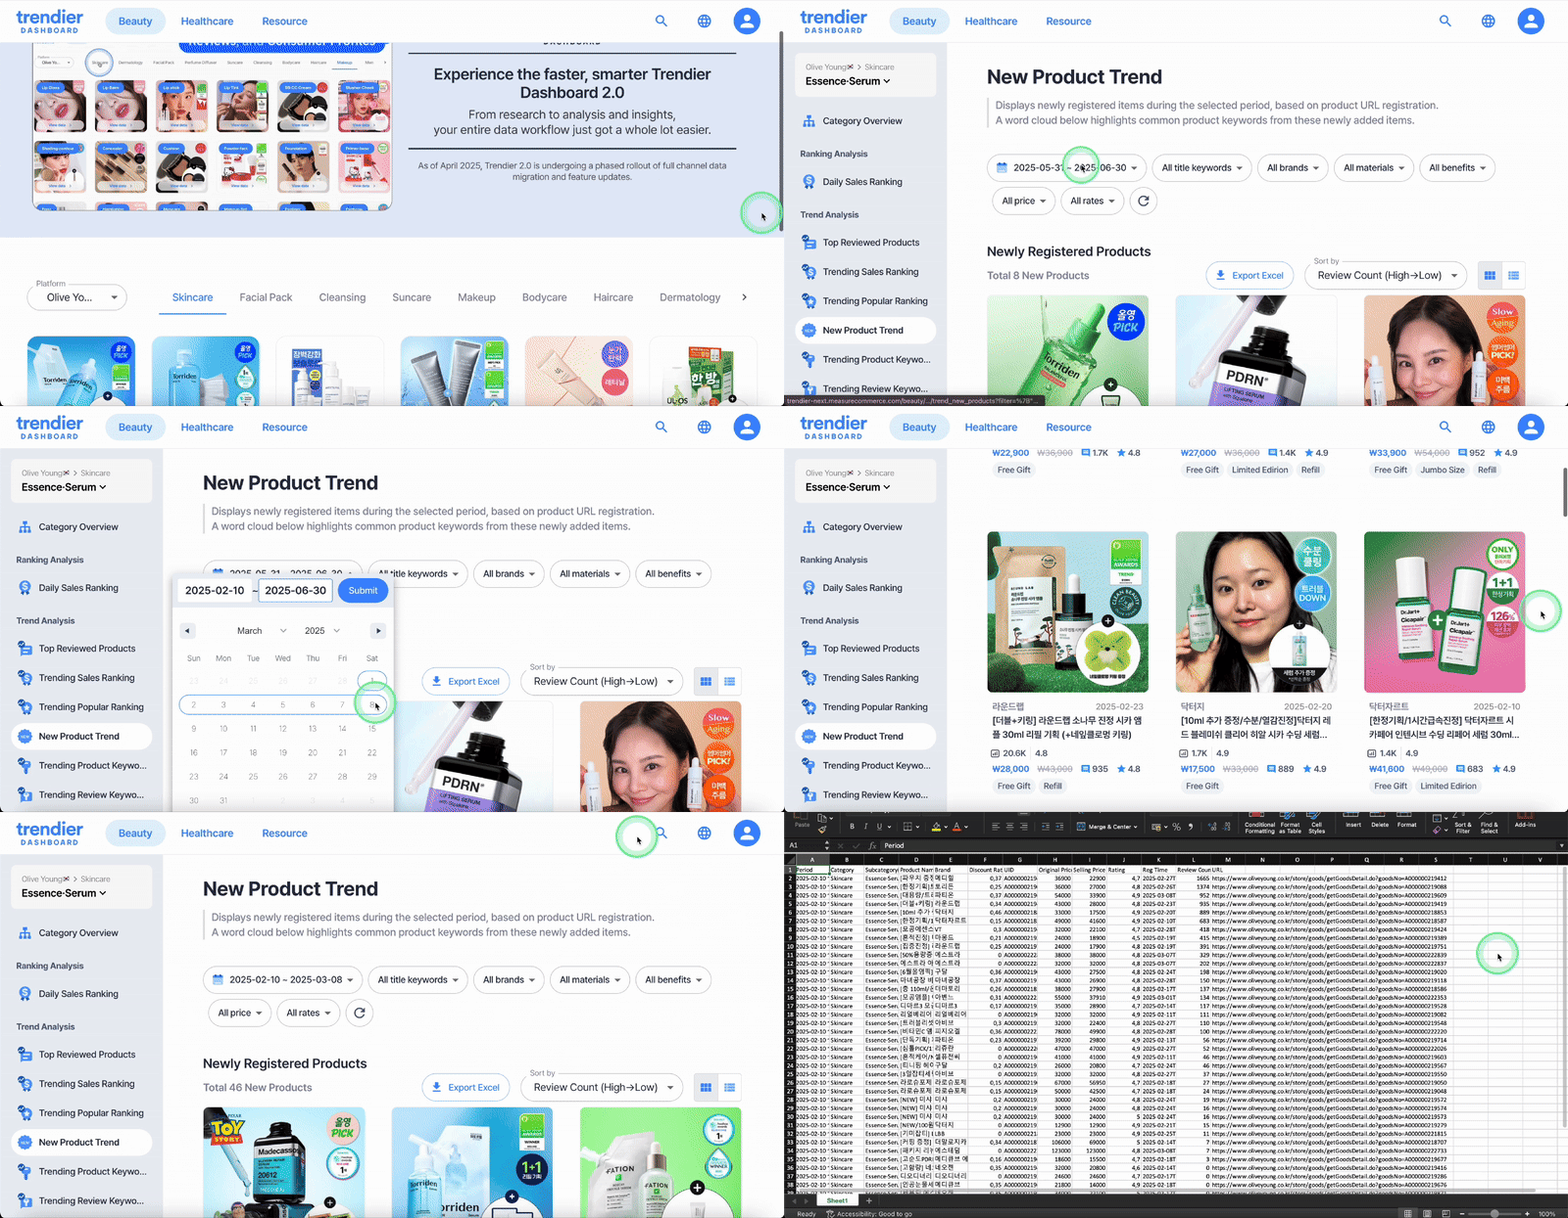
For this analysis, we focused on essence and serum products registered between February 10 and March 8, 2025, just ahead of the Olive Young sale event.
Clicking “Download Excel” gives you a clean list of all SKUs registered during that period.
Want to see it for yourself?
👇 Download the full sample dataset instantly — no signup needed.
Step 2. Writing the ChatGPT Prompts
Once you have the product list, the next step is to give GPT a clear goal — and specific rules for classification. We used GPT-4o version in this analysis.
🎯 Prompt 0 – Define the Goal
“What kind of insight are we looking to get from GPT?”
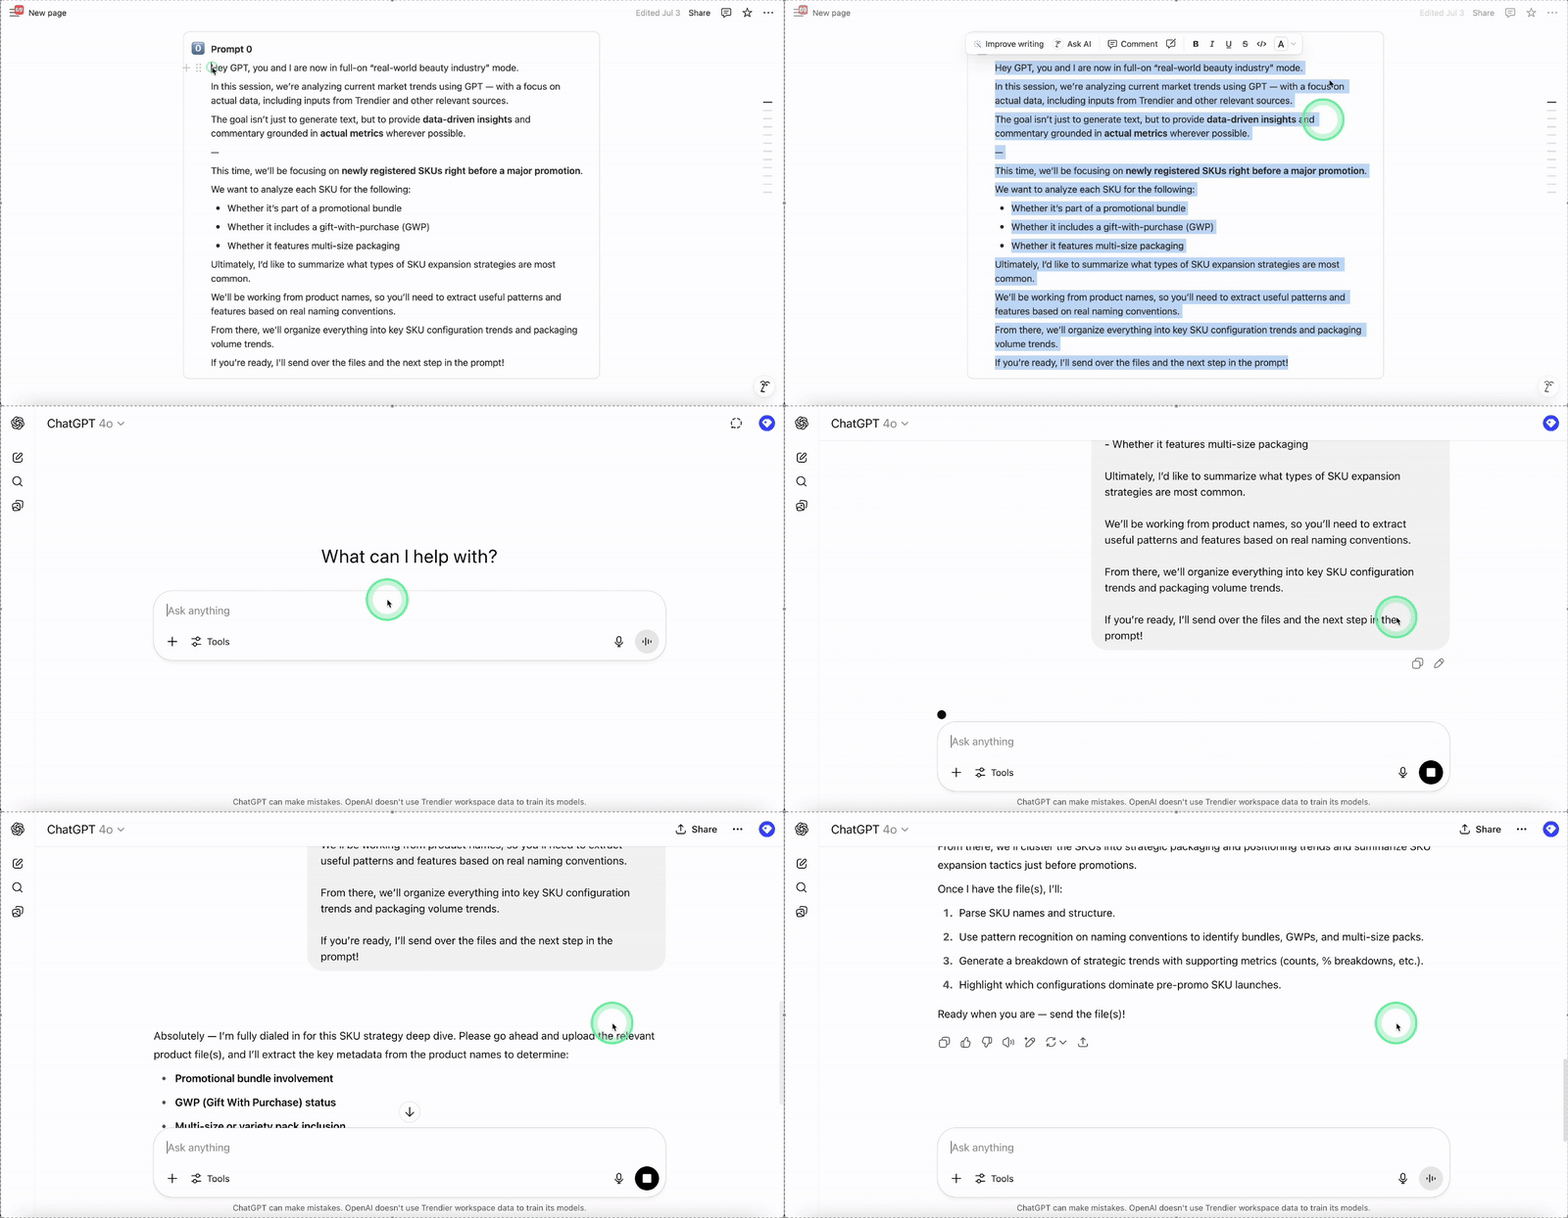
In this step, we aimed to uncover common SKU expansion strategies by analyzing product names — specifically looking for patterns like promotional bundles, gift-with-purchase offers, and multi-size formats. By combining the raw SKU list from Trendier with clear, structured prompts, we used ChatGPT to automatically classify products and highlight key trends in packaging and configuration — all grounded in actual naming conventions from the market.
✏️ Prompt 1 – Classify Product Configurations
“Use product name keywords to classify how each SKU is structured”
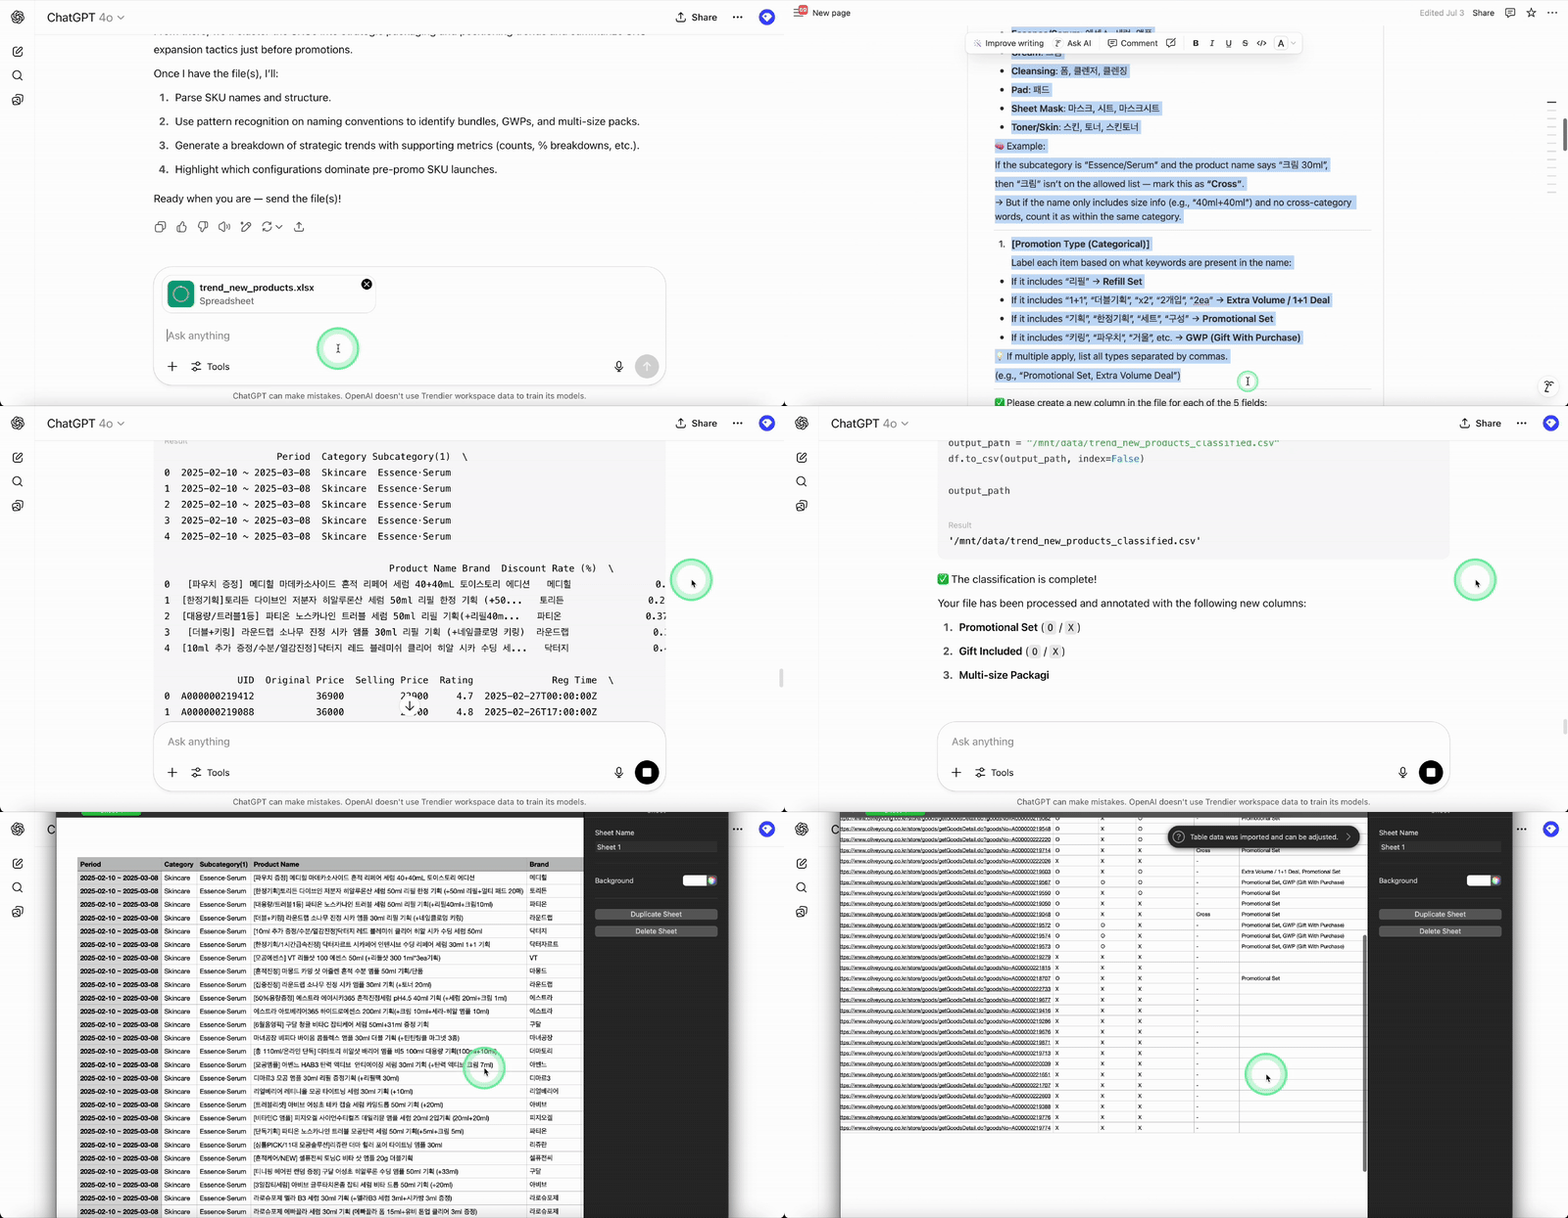
With Prompt 1, we set out to streamline a typically tedious task: tagging product configurations. Instead of reviewing each SKU manually, we prompted ChatGPT to classify every item into key categories — including promotional sets, gift-included SKUs, multi-size packaging, and cross-category bundles — all based on naming patterns. Using a few simple keyword rules, we generated a structured summary for each product and exported a ready-to-use CSV file in seconds.
📦 Prompt 2 – Extract Volume Information
“Extract volume data directly from product names”
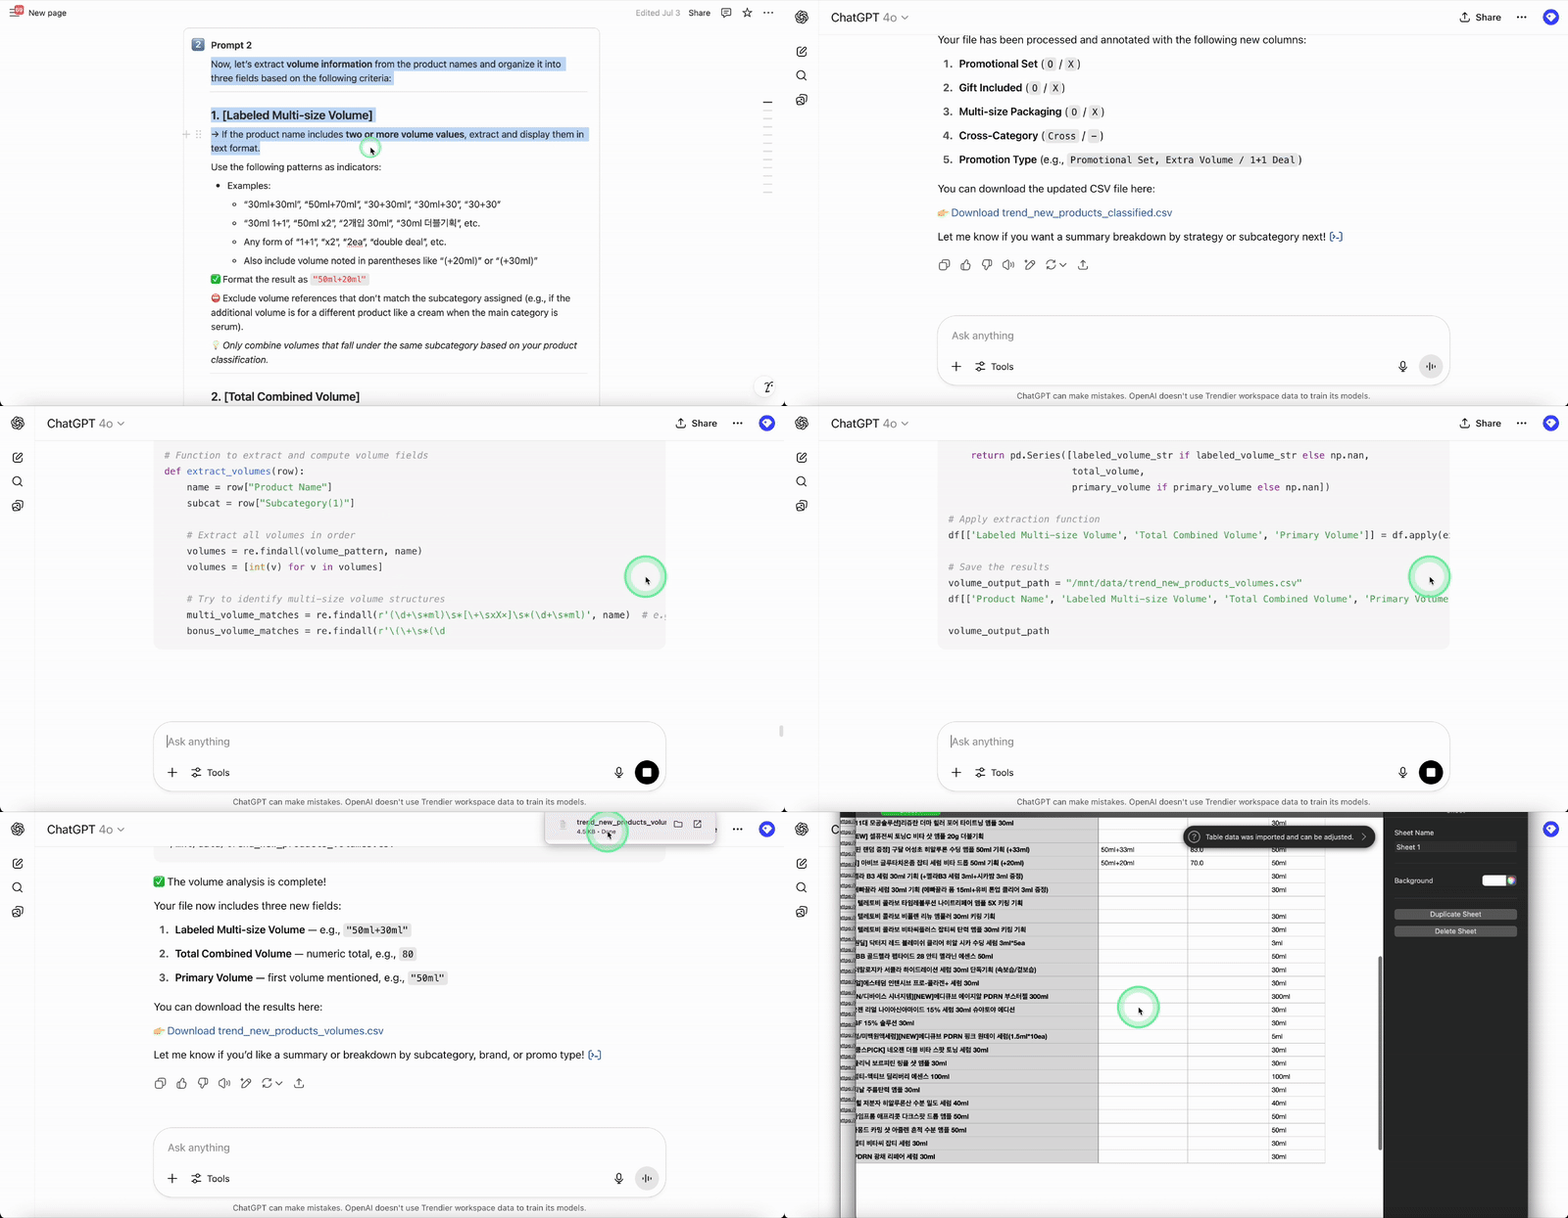
In Prompt 2, we focused on extracting volume-related details directly from product names — a critical step for understanding SKU configurations at scale. ChatGPT was tasked with identifying multi-size packaging (e.g., 30ml + 30ml), calculating total volume, and isolating the base (first-mentioned) volume.
This structured output made it easier to analyze sizing strategies without manual parsing. The outcome was a clean, ready-to-use CSV containing labeled volume formats, total milliliters, and each product’s primary size — all generated in seconds.
📊 Prompt 3 - Distribution Insight
"Break down size trends by volume types"
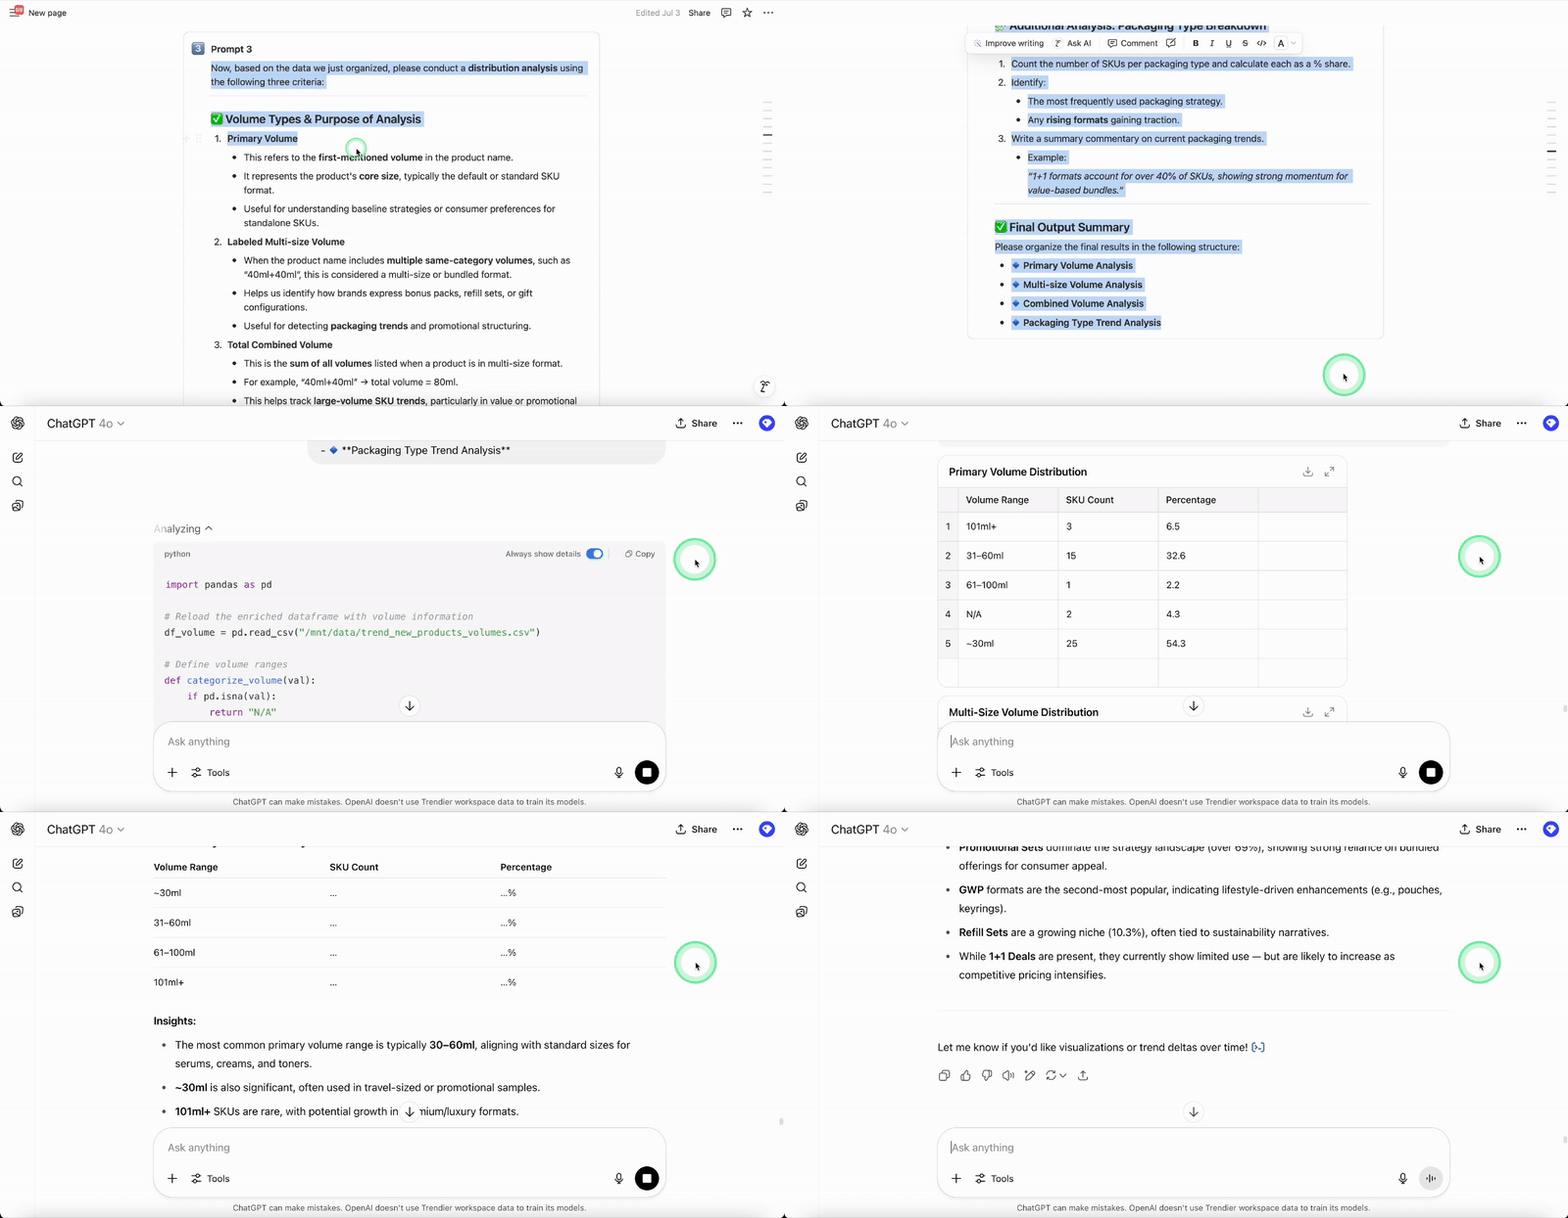
In Prompt 3, we moved from raw extraction to volume distribution analysis. Using the structured data from earlier steps, GPT segmented SKUs by volume range (e.g., ~30ml or 101ml+) across three dimensions: base (primary) volume, labeled multi-size formats, and total combined volume.
It then calculated each segment’s share, identified the most common sizes, and surfaced emerging patterns. Finally, we cross-analyzed these trends with promotion types — providing a clear view of how brands scale product value through sizing strategies.
💡 Cross-Team Applications
This SKU analysis isn’t just for the dashboard — it’s designed to drive action across functions:
- Merchandising teams can monitor trending SKU formats among competitors to guide product selection and onboarding strategy.
- Brand managers can compare similar-volume SKUs and test configurations like refill bundles or 1+1 sets to optimize engagement.
- Marketing teams can track the frequency of gift items (e.g., pouches, keyrings) to refine promotional messaging and campaign hooks.
From raw product data to actionable packaging insights, this entire workflow was powered by simple, structured prompts using GPT. With the right dataset and a clear objective, AI can unlock fast, decision-ready insights that move teams forward.
✅ Want more insights like this? Stay tuned — more Data + AI Automation are on the way.
🚀 Want to try this for your own product planning?

If you're curious to:
- Get the full list of prompts used in this article
- Learn prompt-writing techniques for other common use cases
- Try it all hands-on using your own product or channel data
Sign up for Trendier AI Bootcamp and unlock the next level of AI productivity!